What Building GitLab’s Customer Usage Predictions Taught Me About Outcome-First Deployments
I have a theory. I think most deployments fail not because of bad technology but because nobody defined “done” before the work started.
It really is a litany of things (bad fit customer, loss of exec sponsor, competitor undercut, product issues, etc.), but I really do think that it comes down to the initial expectations. The first date, to mix metaphors.
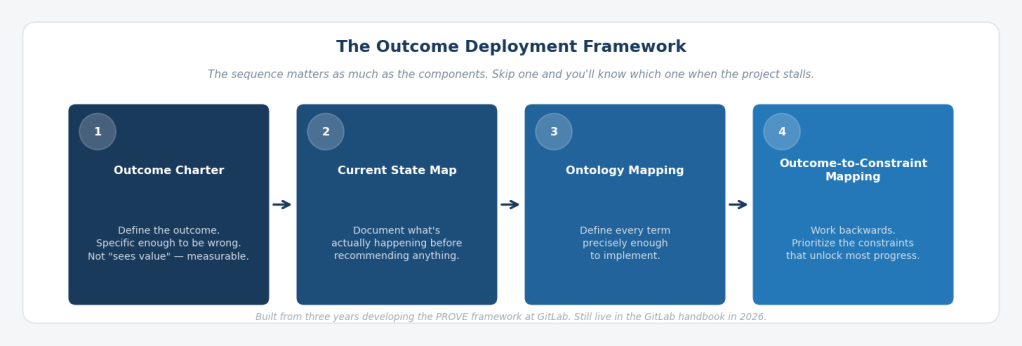
I call the sequence that fixes this the Outcome Deployment Framework (ODF): Outcome Charter, then Current State Map, then Ontology Mapping, then Outcome-to-Constraint Mapping. The sequence matters as much as the components. I learned that the hard way, not in one moment, but across three years and one conference room argument that played out across three regions.
The PROVE Story
We were building the customer health scoring system at GitLab. It ingested product usage data, weighted it against CSM sentiment, support activity, and engagement, and produced a score for every account: green, yellow, or red. We called the framework PROVE: Product, Risk, Outcomes, Voice of the Customer, Engagement. It took the better part of three years to build. We were proud of it.
Then a CSM in US West looked at his scores and said: “Nope. This is wrong. My customer isn’t red.”
He wasn’t alone. Someone in US East followed. Then accounts in EMEA. Within hours we had CSMs across three regions pushing back on scores that called their accounts yellow or red. Some of it was defensiveness: a red score felt like an indictment of their work. But some of it was legitimate. They knew things about their customers that a product usage dashboard couldn’t see.
It felt like one step forward and two steps back. However, our next turn mattered more than the framework itself.
The argument wasn’t about the data. It was about what the data meant.
We pulled the raw usage numbers and sat down with those CSMs. We asked them a question that sounds simple and isn’t: “What should a customer of your size be doing with this product? And: After talking with your customer, tell us what they think about their usage.”
Nobody had a clean answer. Not because they didn’t know their customers. They did. But because “healthy” had never been defined in terms specific enough to argue with. It was a feeling. And feelings, as I learned, are very hard to improve.
One example stayed with me. A major enterprise customer had low CI pipeline utilization, which the system flagged as risk. The CSM pushed back hard. When we dug into the data together, we discovered the customer had a large percentage of non-developer personas: project managers, compliance officers, business analysts. Low CI usage wasn’t adoption failure. It was a persona mix that the metric didn’t account for. The CSM was right that the score was incomplete. The score was right that the adoption pattern was narrow.
Both things were true at once. And that tension between what a number shows and what it means in context is the problem that most health scoring projects never actually solve. They build a score. But do they always build a shared definition of what the score is measuring?
That’s definitional failure. And it’s also, I’ve come to believe, the central failure mode in AI-native deployments today. MIT research (2025) found that 95% of GenAI pilots fail to scale to production deployment. The most common root cause: stakeholders never aligned on what problem they were solving before they started building. Aaron Levie, CEO of Box, put the vendor implication directly: “There’s no shortcut to getting this work done by the enterprise, and the vendors are going to have to do a lot of this or risk low adoption.” The Outcome Deployment Framework is the structured way to do it — not the heroic way.
The Outcome Deployment Framework
Here’s what we learned from building PROVE between 2020 and 2023, before “outcomes” became a conference keynote: the sequence matters as much as the components.
Before we configured a single Gainsight rule, we should have refined these four things, in this order:
Outcome Charter. Not “improve customer health.” Something specific enough to be wrong: more than 95% of customers with a health score, backtested and validated as effective, used by CSMs, Sales, and Product as a company-level metric. The Outcome Charter existed for PROVE. Eventually. We had a version but it was weak and unclear. We clarified it after we’d already built the first version, which meant we built the wrong thing first and spent months correcting it. C’est la vie.
Current State Map. In early 2022, our product usage data covered roughly a third of self-managed ARR and none of our SaaS customers. Forty percent of our SaaS metrics were broken because of a technical counter limitation. Cloud License rollout was behind target. This wasn’t a health scoring problem; it was a data fidelity problem that no amount of framework design could fix. Documenting that reality first, before recommending any improvement, is the Current State Map. It’s not glamorous. It is the work.
Ontology Mapping. What does “adopted” mean for Source Code Management versus CI versus DevSecOps? What is a user? What constitutes engagement in a 28-day window? These aren’t product questions. They’re definitional questions, and they have to be answered explicitly before any system can execute against them. SCM adoption meant more than 33% of billable users triggering a Git operation in the last 28 days. CI adoption meant more than 40 CI builds per billable user in that same window. Those thresholds required months of analysis against known-healthy and churned and at-risk customers to establish. The health scoring methodology we built for GitLab is, in retrospect, an ontology document: a written record of what every term means, precise enough to implement. We just didn’t call it that at the time. My colleague, Michael, kept bringing us back to this point. Once again, thank you Michael!
Outcome-to-Constraint Mapping. Once the outcome was chartered, the current state documented, and the terms defined, the constraints became visible: data coverage gaps, SaaS metric failures, namespace ID gaps, Cloud License adoption lag. We didn’t try to fix everything. We prioritized the two or three constraints whose removal would unlock the most progress toward the outcome. My friend and colleague Justin helped focus it even further. That’s the difference between a list of problems and a prioritized theory of change.
The ODF builds the system your team needs to turn deployment from a series of heroic individual efforts into a repeatable, scalable motion.
What Happened When We Ran It
When the CSMs argued with the scores, we (at first) defended the methodology…then we handed them the data and asked them to improve it.
Most of the time, what emerged wasn’t that the score was wrong. It was that the customer was single-threaded: deeply embedded in one feature, completely absent from the rest of the ecosystem. High SCM adoption, low CI, no DevSecOps. Technically not at risk in the traditional sense. But exposed. If that one feature ever became a commodity, or if a competitor offered it cheaper, there was nothing else holding the relationship. And that happened.
Exposing that pattern changed how we talked about customers. The conversation moved from “I feel my customer is healthy” to “here are the specific parts of the product they’re using and not using, and here’s what it would take to close the gap.” That shift, from sentiment to evidence, is what made the framework useful. Actionable.
It also created a feedback loop we hadn’t anticipated. CSMs who showed customers their adoption data came back with something more valuable than a renewal: they came back with insights. Customers wanted to know how to use more of the product. They asked for workshops. They requested a regular cadence of business reviews built around usage data. Several accounts led to introductions into security and compliance teams that opened use case expansion conversations. Usage data surfaced persona mix issues that led to more accurate upgrade scoping.
Nearly 45 technical account managers presented Use Case Adoption Scores to at least one customer in the months after we launched. Most of those conversations led to enablement workshops, deeper engagement, and, over time, customers who saw more value, expanded more, and churned less. Win-win.
The framework also pushed something we hadn’t planned for: the CSM role itself had to change. The conversations that usage data opened required technical depth that a traditional relationship-focused CSM didn’t have. We moved toward a more technical CSM model: one who could sit with a customer, walk through their adoption data, and help them actually use more of the product with hands-on-keyboard approaches. That transition wasn’t a staffing decision. It was a consequence of finally knowing what “healthy” meant and what the customer really needed to succeed.
The PROVE framework is still live in the GitLab handbook in 2026, more than three years after I left. Someone else owns it. It survived rotation. That’s what a working framework produces: institutional memory that doesn’t depend on the person who built it.
That’s the phase one to phase two transition. Not a milestone you plan for. One you recognize when it happens, and name explicitly, so the organization knows it’s crossed something.
A Different Context, the Same Problem
In 2024 I joined Mercy Ships as Finance Director aboard the M/V Global Mercy in Freetown, Sierra Leone as a volunteer for two years. The same four steps applied to fixing a suboptimal expense reimbursement process for crew: no Gainsight, no ARR, no product usage data. Rotating volunteers from forty-plus countries, partly missing documentation, very manual processes, and almost everything requiring human intervention.
Nobody had defined what “done” looked like before the process started. The terms meant different things to different people. The current state had never been mapped. The constraints were invisible until we named them.
I wrote about that work here. The sequence held.
If the Outcome Deployment Framework works on a ship in West Africa, with rotating volunteers and many different obstacles and also at a fast-growing tech company, can’t it work everywhere? The constraints that break an expense reimbursement process on a hospital ship are structurally identical to the constraints that break an AI-native SaaS deployment. Nobody defined “done.” Nobody mapped what was actually happening. Nobody agreed on what the terms meant. Nobody worked backwards from the outcome to find what was blocking it.
The context changes. The failure mode doesn’t.
How this applies beyond Customer Success Ops. The Outcome Deployment Framework was built in a CS Ops context, but the failure mode it addresses is universal. Whether we’re deploying an AI agent, rebuilding a broken process, or implementing a new workflow system, the four steps apply. Define the outcome precisely. Map what’s actually happening. Agree on what your terms mean. Work backwards from the outcome to what’s blocking it. Skip one and you’ll know which one you skipped when the project stalls.
The Question Worth Sitting With
Before your next deployment begins, before the first integration is configured, before the first workflow is mapped, before the first customer call: can you write down in one sentence, in the customer’s language, what “done” looks like?
Not “successful deployment.” Not “customer sees value.” Something specific enough to be wrong.
If you can’t write that sentence, the ODF starts there.
And if you’re building a forward-deployed team: engineers embedded with customers, responsible for outcomes, operating in the space between your product and your customer’s reality, that feedback loop is exactly what makes the model scale. The system behind the work that captures what each deployment teaches and makes the next one smarter. This is that crazy good feedback loop we all crave.
That’s what PROVE was, at its core. Not a health score. A feedback loop with a memory.
The PROVE framework and use case adoption scorecards I developed at GitLab are still in active use. You can find them in the GitLab handbook at the Customer Health Scoring and Use Case Adoption Scoring pages.
